


Arctic Ice Melt: The Clock Is Ticking

As a physical oceanographer, I am part of ARCTIC-FLOW, a European Space Agency project investigating how Arctic ice melt affects global ocean circulation. This vital research focuses on the Arctic’s dramatic transformation and its implications for Earth’s climate systems.

The Arctic is warming at an unprecedented pace, with sea ice vanishing at rates that alarm scientists worldwide.
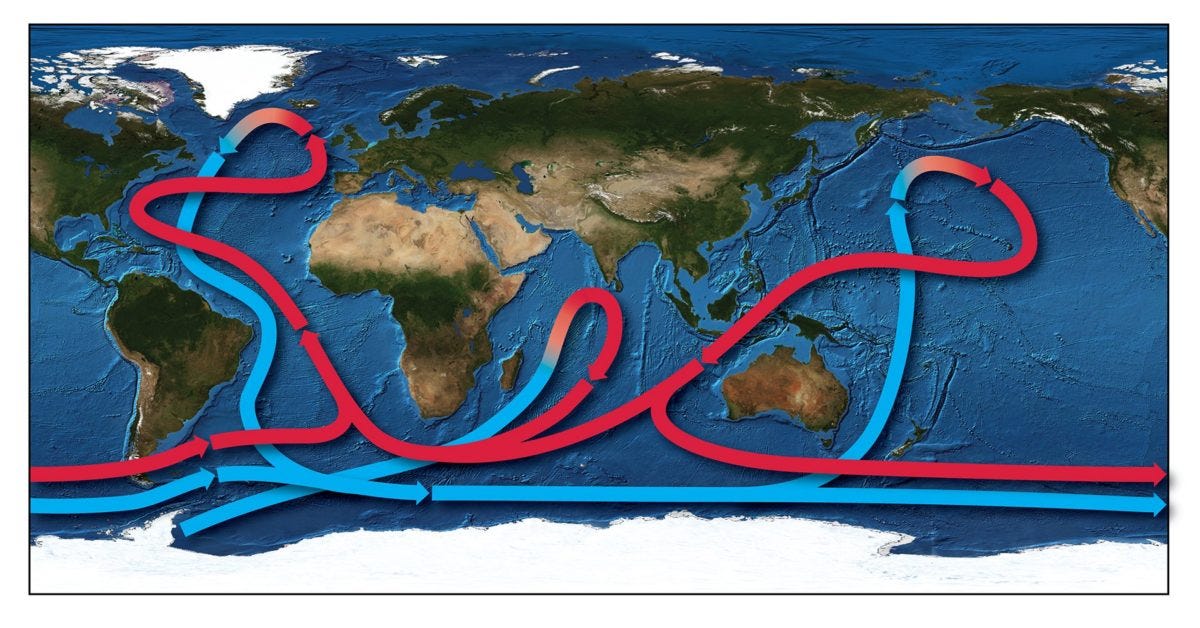
The Climate Conveyor Belt: A Schematic
The global ocean circulation system, driven by temperature and salinity contrasts, functions like a conveyor belt. Warm, salty water flows northward, cools, sinks, and returns southward along the ocean floor. This process, known as thermohaline circulation, is crucial for regulating Earth’s climate.
Arctic ice melt disrupts this balance by diluting seawater with freshwater. This slows the sinking of cold, dense water in the North Atlantic, weakening the conveyor belt. The ripple effects are immense, from disrupting fisheries to altering global rainfall patterns.
A recent study suggests that AMOC has slowed by 15%–50% over the past century. To put this into perspective, a 15% slowdown would mean the equivalent of 1,080 Olympic swimming pools of water are no longer being moved every second. This dramatic reduction in water circulation could trigger widespread chaos. Similarly, a weakening AMOC can intensify tropical storms, bring harsher winters to Europe, and raise sea levels along the U.S. East Coast..
How Do Scientists Know the Arctic Is Melting?
Understanding the rapid melting of the Arctic ice sheet isn’t a simple task. Scientists use a combination of advanced satellites and on-the-ground (in-situ) observations to monitor, measure, and interpret changes in ice thickness, area, and flow. These tools allow researchers to build a complete picture of how much ice is disappearing, how fast, and why.
Satellites: Eyes in the Sky
Satellites revolutionized the way we monitor Earth’s polar regions. From orbit, they provide a bird’s-eye view of the Arctic, offering continuous, high-resolution measurements of ice cover, thickness, and even its movement.
1. NASA’s GRACE and GRACE-FO Missions
These satellites measure changes in Earth’s gravitational field caused by melting ice. As Greenland’s ice mass decreases, it alters the local gravity, which GRACE detects with remarkable precision. These data show that Greenland loses roughly 280 gigatons of ice annually, equivalent to nearly 112 million Olympic swimming pools draining into the ocean every year. The animation below shows Greenlands ice loss from 2002 to 2023 (Credit: NASA and JPL/Caltech: Felix W. Landerer and Marit Jentoft-Nilsen).
2. Sentinel-1 and Sentinel-2 Missions
Part of the European Space Agency’s (ESA) Copernicus Program, these satellites use radar to track ice sheet movement and detect surface meltwater. Radar can penetrate clouds and darkness, making it especially useful for Arctic observations. The animation below uses data from sentinel 1 and 2 along with other satellites from NASA and climate models to show Greenlands ice loss from 1992-2017 (Credit: ESA/NASA/IMBIE/Planetary Visions).
In-Situ Observations: Feet on the Ice
While satellites provide a broad overview, in-situ methods give scientists granular data to validate and refine satellite measurements.
1. Meltwater Runoff Monitoring
Scientists measure rivers of meltwater flowing off the ice sheet into the ocean. By calculating the volume and speed of this flow, researchers estimate surface melt contributions to sea level rise.
2. Ice Core Drilling
Drilling into the ice sheet allows scientists to analyze layers of ice and snow for clues about historical and recent melting. These cores reveal the extent of basal melting (melt from the bottom caused by geothermal heat or warm ocean water) versus surface melting.

3. Automatic Weather Stations (AWS)
Placed across Greenland, AWS devices record temperature, precipitation, and wind speed to track conditions driving ice melt.
4. GPS and Seismometers
By placing GPS units on the ice, scientists track its movement. Seismometers detect the calving of icebergs, providing data on how fast the ice is breaking apart.
Challenges and Uncertainties
Even with these advanced tools, measuring Arctic melt is fraught with uncertainties. Different satellite missions occasionally produce conflicting results, and ground measurements may miss areas due to the sheer size of the ice sheet.
For example, while GRACE data may show large-scale ice loss, Sentinel-2 might detect localized thickening due to snowfall. These apparent contradictions stem from the complexity of the system and the different techniques used. Scientists reconcile these differences by combining datasets, much like solving a multidimensional puzzle.
This blending of approaches ensures that our understanding of Arctic melt is as accurate as possible. The result? A grim yet invaluable portrait of how the Arctic is transforming—and the cascading effects it has on our planet.
But All Is Not Lost
Earth’s climate system, though delicate, has a remarkable ability to adapt. Take, for example, the paradox of a weakened thermohaline circulation. As temperatures rise and ice melts, more heat may get trapped in the tropics, while the North Atlantic cools. Over the long term, this process could trigger ice growth in polar regions, potentially helping to stabilize the climate system.
Other feedbacks, though counterintuitive, reflect the planet’s resilience. For instance, increasing CO₂ levels enhance silicate weathering, which draws down carbon over millennia. These processes remind us that while human-induced changes strain the system, Earth continuously seeks equilibrium.
Our focus should be on understanding these dynamics, not just to mitigate harm but to marvel at the ingenuity of a system that strives to balance itself, no matter the odds.
What’s Next for the Arctic Series?
In the next blog post, we’ll dive deep into the Atlantic Meridional Overturning Circulation (AMOC)—a critical component of Earth’s climate engine. We’ll explore its past, present, and future states, asking:
• What exactly is the AMOC?
• How has it changed over centuries, from the Ice Ages to today?
• How do scientists measure its strength and fluctuations using tools like ocean buoys, satellites, and models?
Finally, we’ll look at what recent research says about its potential collapse—what that could mean for global weather patterns, the Arctic, and beyond. This post will set the stage for a broader understanding of how Arctic changes ripple through the entire climate system.
Stay tuned for a journey into one of the most fascinating and consequential processes shaping our planet!