The Atlantic Ocean’s Current: How Changes in Its Flow Are Shaping Our Climate
Exploring the Vital Ocean Circulation That Drives Weather Patterns and the Impact of Its Slowdown
Welcome Back to the Blog: A Deep Dive Into AMOC
Last time, we hinted that we’d be taking a closer look at the Atlantic Meridional Overturning Circulation (AMOC), and in today’s post, we’ll finally break it down in depth. We’ll explore AMOC in three parts:
1. The Current State of AMOC – A schematic representation of its function and its influence on the global climate.
2. How We Know AMOC is Changing – How scientists use both models and in-situ observations, including the emerging role of satellites.
3. What AMOC Weakening Means for Us – How the slowdown of AMOC impacts global weather patterns and changes in climate, with a focus on the immediate effects we’re seeing today.
By the end, we’ll be tying everything back to recent extreme weather events.
The Atlantic Ocean’s Circulation System: AMOC Explained
Meridional Overturning (the MO in AMOC), refers to the large-scale movement of ocean water that helps regulate Earth’s climate. Warm water from the tropics moves towards the poles, while colder water sinks from the poles and flows back toward the equator. This process helps distribute heat around the planet, affecting weather patterns and keeping regions like Western Europe warmer than they would otherwise be. It’s like a giant ocean highway that circulates heat and moisture across the oceans.
AMOC is often referred to as the Great Conveyor Belt of the ocean because it plays a central role in regulating the Earth’s climate. Picture a vast, slow-moving ocean current that stretches throughout the Atlantic; all the way from Antarctica to the Arctic. This circulation is not just moving water—it’s moving heat, salt, and nutrients, all of which have profound effects on the atmosphere and weather.
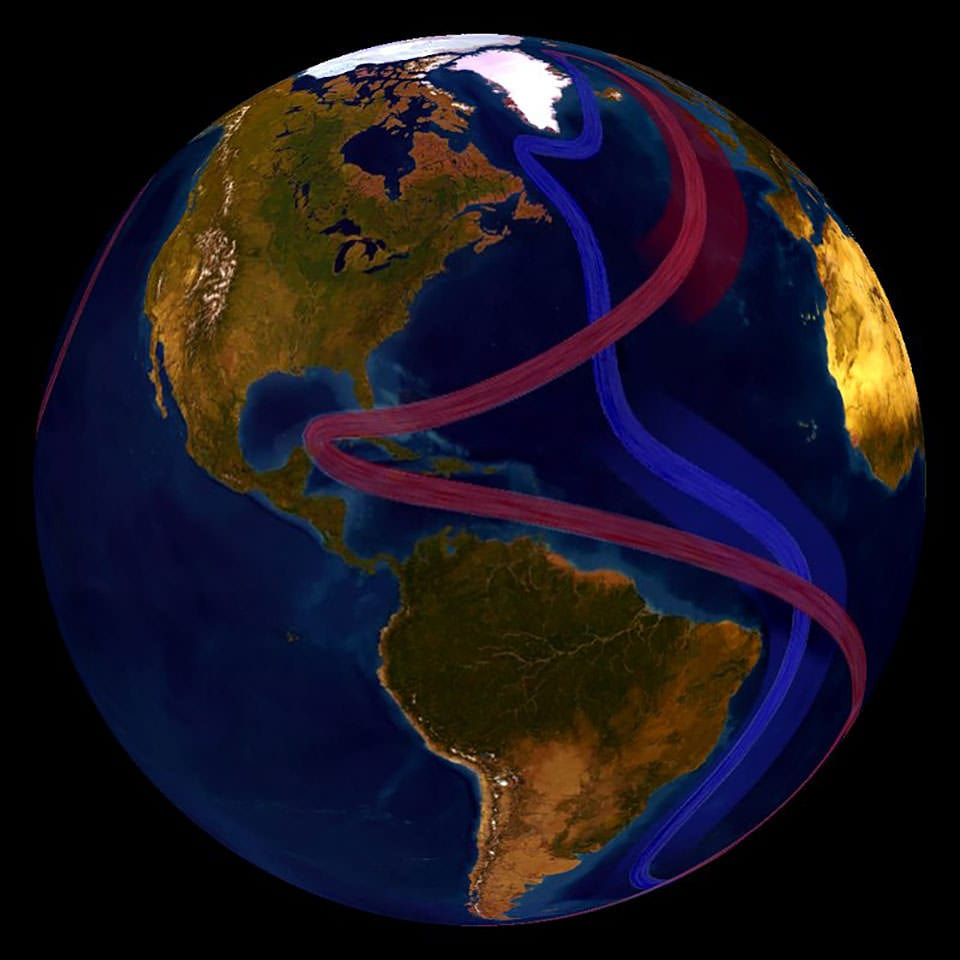
Let’s break it down using a schematic representation of AMOC (based on data from NOAA)

1. Arctic (Sinking Waters): The journey of the ocean’s circulation begins in the Arctic, where cold, dense water sinks beneath the surface. As the water cools, it becomes heavier and sinks deep into the ocean. This dense water is the start of the process that drives the Atlantic Meridional Overturning Circulation (AMOC), moving toward the equator at deeper ocean levels.
2. Southern Ocean: From the Arctic, the sinking cold water travels southward toward the Southern Ocean. Here, it continues to flow deeper into the ocean’s currents, essentially making its way around Antarctica. The cold water starts to meet other ocean currents in this region, aiding in the global movement of water.
3. South Atlantic: The deep, cold water from the Southern Ocean begins its northward journey. As it travels through the South Atlantic, it gradually picks up heat from warmer surface currents. The cold water starts to mix with warmer ocean water, which helps it gain heat and rise toward the surface as it continues north.
4. Tropics: In the tropics, warm surface waters are pushed northward by the trade winds. These currents carry heat from the equator to higher latitudes. As this warm water moves, it flows along the ocean surface, continuing to feed into the circulation loop.
5. North Atlantic (Gulf Stream): One of the most well-known aspects of AMOC, the Gulf Stream, transports warm waters from the tropics to the North Atlantic. This warm water helps moderate the climate of regions like Western Europe, making their winters much milder than places at similar latitudes. The heat released into the atmosphere from the ocean surface is a key factor in this regional climate influence.
6. Return Flow (Southern Ocean): As the water reaches the North Atlantic and cools, it eventually sinks again, continuing the circulation. This return flow travels through the Southern Ocean, where the process of cold water sinking starts all over again. This return flow helps balance the heat distribution, ensuring that the ocean’s currents maintain their crucial role in regulating global climate.
This cyclical process of ocean circulation—where warm water moves north, cools and sinks in the Arctic, and returns south—is a key component in regulating Earth’s climate. The ongoing interaction between warm and cold waters shapes not only the global climate but also marine ecosystems by transporting nutrients between the surface and deep ocean layers.
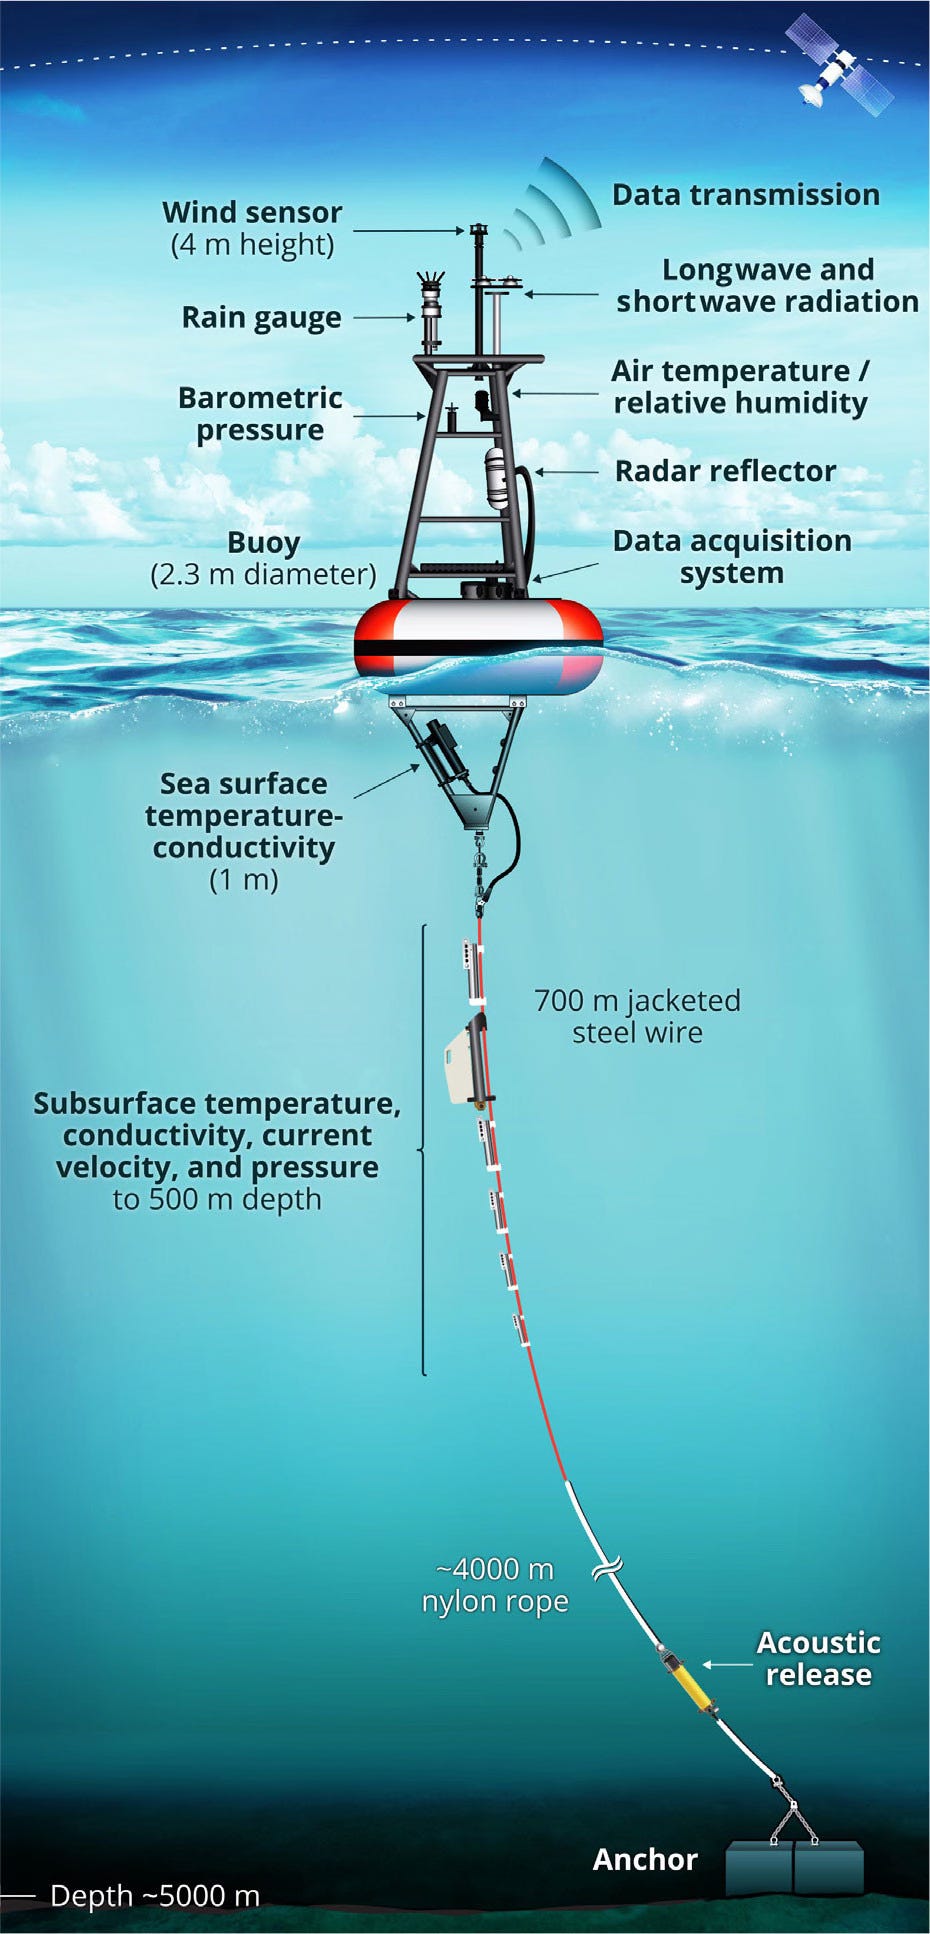
Throughout this system, scientists have set up monitoring stations in key locations across the Atlantic. These stations measure water temperature, salinity, and currents at various depths. Understanding these movements is essential because they help us track the overall health of AMOC and predict how changes in the ocean will affect our climate.
The Strength of AMOC: Insights From Models and In-Situ Observations
Understanding the strength of the Atlantic Meridional Overturning Circulation (AMOC) requires a combination of tools: in-situ measurements—data collected directly from the ocean—and numerical models that simulate its behavior. While these approaches provide invaluable insights, they often paint slightly different pictures of the AMOC’s current state, its trends over time, and its projected future.
The differences between these methods underscore the complexities and uncertainties involved in measuring and simulating a system as vast and intricate as AMOC. Below, we delve into the contributions of each method and highlight the challenges in reconciling their findings.
In-Situ Observations of AMOC Strength
In-situ observations rely on physical measurements collected from instruments deployed directly in the ocean. These include mooring arrays and floats.

A 2018 analysis of that data found that the AMOC transports approximately 17 million cubic meters per second—equivalent to 8,500 Olympic swimming pools per second. While this is within the range expected for a stable AMOC, the data also shows considerable year-to-year variability. Over its dataset, spanning nearly two decades, the AMOC’s strength has declined by an average of 0.28 Sverdrups per decade. To put that in perspective, 0.28 Sverdrups is equivalent to the loss of approximately 140 Olympic swimming pools of water per second from the system every decade.
Numerical Models and Simulated AMOC Trends
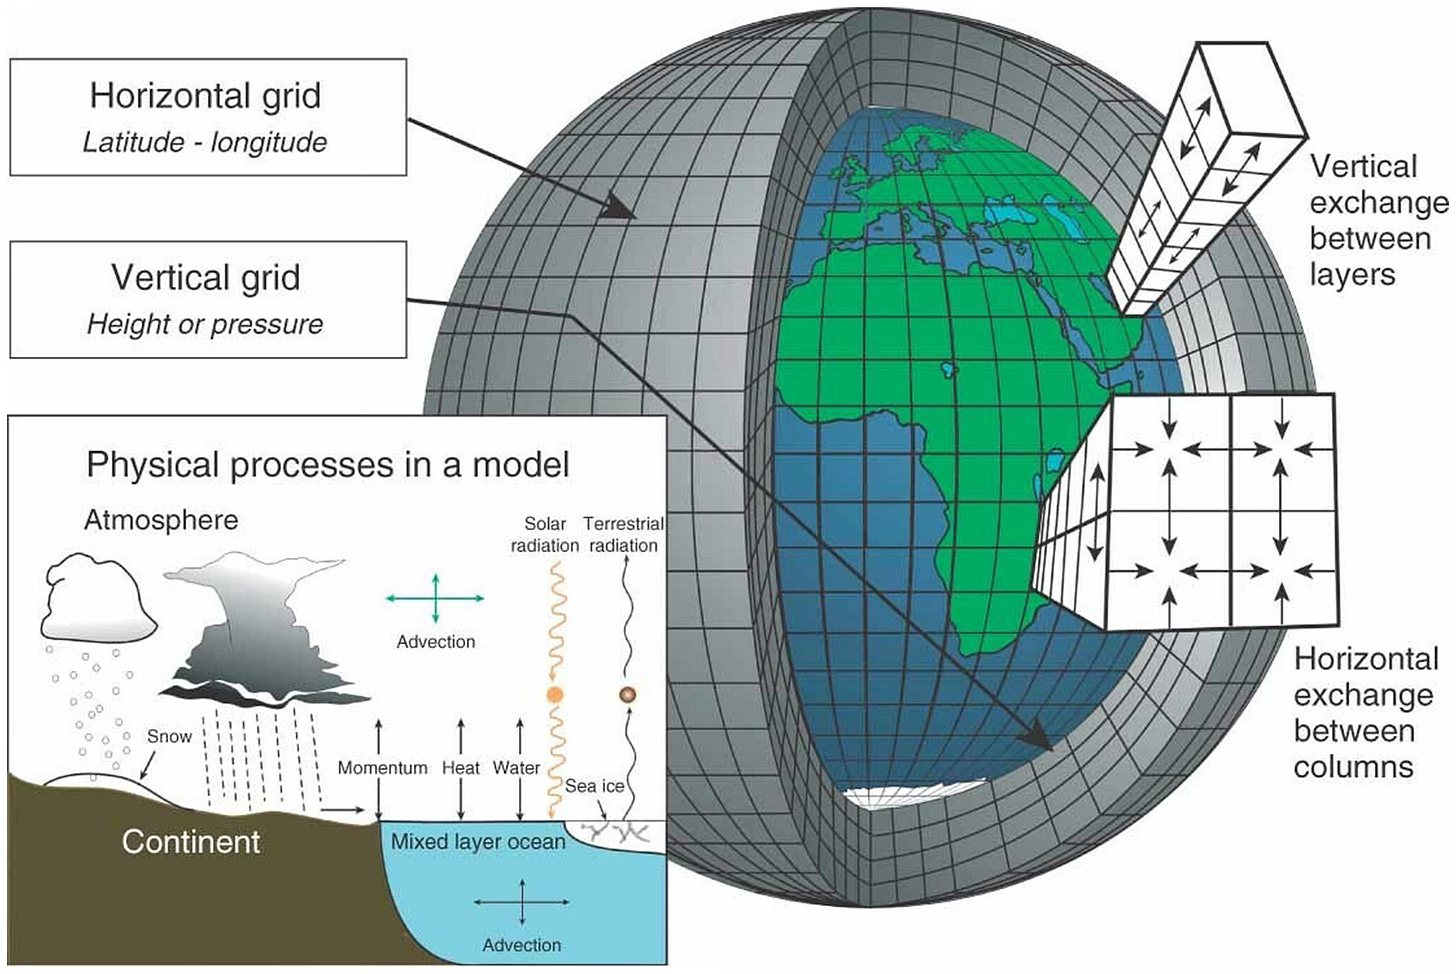
Numerical models simulate the AMOC by solving equations that describe ocean physics. These models incorporate data on temperature, salinity, and atmospheric forcing, allowing scientists to predict how the AMOC will respond under different climate scenarios.

Another 2018 study, estimated that the AMOC has weakened by approximately 15% since the 1950s, largely due to increased freshwater input from melting ice sheets and rising global temperatures.
A Diverging Picture: In-Situ vs. Models
The results from in-situ observations and models often diverge. Observations reveal substantial short-term variability in the AMOC, while models tend to smooth out these fluctuations, focusing instead on long-term behaviour.
AMOC Weakening: How It Will Change Our Climate
Recent papers have shown a concerning trend: AMOC is slowing down, and it could have serious consequences for the world’s climate. A study published in Science Advances suggests that AMOC, which includes the Gulf Stream, is approaching a critical threshold, with the potential for significant weakening and shifts in ocean circulation patterns. This weakening is tied to several factors, but global warming is the biggest culprit.
A warming Arctic is releasing more freshwater into the North Atlantic. This freshwater dilutes the salty, dense water needed for the sinking process that drives AMOC. As a result, the ocean’s ability to circulate is diminished, and the heat that the ocean usually moves around the globe is left to accumulate in the tropics.
Driving the Ocean Conveyor: The animation below highlights the Gulf Stream’s powerful currents and the sinking of dense water in the Arctic. together they fuel AMOC—a vital system now at risk from climate change-induced disruptions (Credit: NASA/Goddard Space Flight Center Scientific Visualization Studio).
What Does This Mean for Weather?
The impact of AMOC’s weakening is already being felt. Western Europe, for example, is predicted to experience colder winters as less heat is carried northward from the tropics. Interestingly, if we look at places like New York City and London, both are situated at nearly the same latitude (40°N). However, New York experiences harsher winters, while London enjoys relatively mild ones. This difference can be attributed to the Gulf Stream and AMOC, which bring heat to Europe but leave North America more exposed to cold Arctic air.
As AMOC weakens, the water levels along the U.S. East Coast are also rising, with recent research from 2023 showing a possible accelerated rate of sea level rise due to weakening Atlantic ocean circulation.
Recent Weather Extremes and AMOC’s Role
In recent years, we’ve seen severe weather events unfold across the globe. Record heatwaves in the U.S. and Europe, devastating floods in China, and more frequent hurricanes in the Caribbean—all of these extreme weather events can be linked to the destabilization of the global climate system, which is influenced by AMOC.

Scientists have warned that continued weakening of AMOC could lead to even more extreme weather patterns, with stronger storms, rising sea levels, and unpredictable climate changes. The 2024 hurricane season in the Atlantic is one of the most active on record, and researchers are studying how shifts in AMOC might be contributing to this volatility.

In the Next Post: The Past State of AMOC—A Journey from the Nuclear Age
In our next post, we’ll dive into the history of AMOC and explore how modern oceanography, specifically the study of circulation, began in the wake of World War II. The atomic testing of the post-war era played a crucial role in shaping our understanding of ocean currents, and we’ll look at how scientists used nuclear fallout as a tool to study the movement of water in the Atlantic. Stay tuned as we uncover how the Cold War and oceanography intersected in unexpected ways!

